There are many test automation tools available in the market today. WebLoad, LoadNinja, LoadRunner, and LoadUIPro to name a few. But it is JMeter that has become a trending name in the industry.
Why JMeter is gaining popularity among app testers and app development industry? Does JMeter truly deserve the popularity it is gaining?
To answer this, we have to start with the basics.
- What is JMeter?
- Why do we use Jmeter?
- How JMeter Works?
- Advantages of JMeter
- Disadvantages of JMeter
- Demo 1 : How to Perform JMeter Load Testing
What is JMeter?
JMeter also known as ‘Apache JMeter’ is an open-source, 100% java based application with a graphical interface. It is designed to analyze and measure the performance and load functional behavior of web applications and a variety of services.
JMeter is mainly used for testing Web applications or FTP applications but currently, it is applicable in functional testing, JDBC database connections, Web services, generic TCP connections, and OS native processes. You can perform various testing activities like Performance, Load, Stress, Regression, and Functional testing, in order to get accurate performance metrics against your web server.
JMeter was originally written and developed by Stefano Mazzocchi of the Apache Software Foundation. It was primarily written to test the performance of Apache JServ(currently known as the Apache Tomcat project). Apache redesigned JMeter to enhance the GUI, to add more features and functional testing capabilities.
JMeter is not a browser and it doesn’t render HTML pages like any browser does, rather it works on a protocol level.
Following is a list of protocols supported by JMeter:
- Web Services – SOAP / XML-RPC
- Web – HTTP, HTTPS sites ‘web 1.0’ web 2.0 (ajax, flex and flex-ws-amf)
- Database via JDBC drivers
- Directory – LDAP
- Messaging-oriented service via JMS
- Service – POP3, IMAP, SMTP
Why do we use Jmeter?
In addition to load testing, testers can use Apache JMeter to perform performance, spike, and unit testing.
- Performance testing is the process of determining the speed, responsiveness, and stability of a computer, network, software program or device under a workload.
- Spike testing is a form of load testing which rapidly increases and decreases the load over short bursts of time before returning to an average load. Spike tests simulate a system where there is an unexpected increase and decrease in loads (for example an e-commerce store on Black Friday).
- Unit tests will analyze the smallest testable parts of an application. Jmeter can be used to unit test processes and protocols such as JDBCdatabase connections, LDAP, JMS and HTTP.
While JMeter has gained immense popularity in Load testing, it is also a great tool to test other application areas like APIs, FTP servers, database performance, etc. It helps to measure and analyze the performance of web applications and other variety of services.
Let’s say that your organization recently launched a commercial web application that will be accessed across the globe. Your organization is expecting that it will have hundreds and thousands of concurrent users accessing the website. So, the web servers must be able to handle the user action efficiently.
Your organization is keen to know how the web servers will perform in such situations.
As a tester, you need to provide results in such a scenario. It is not feasible for any organization to arrange that many testers to manually check the performance.
The next question which arises here is: How would you test your website in such a situation? How can you apply such a huge load on web servers and get results?
In such situations, a tool that can simulate real-time user’s behavior is required and thankfully, JMeter is such a tool that can help you do such testing. JMeter has proved to be the best tool for load testing so far.
How JMeter Works?
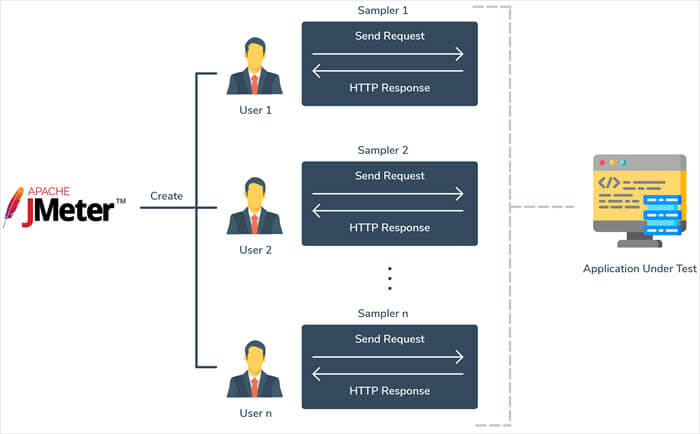
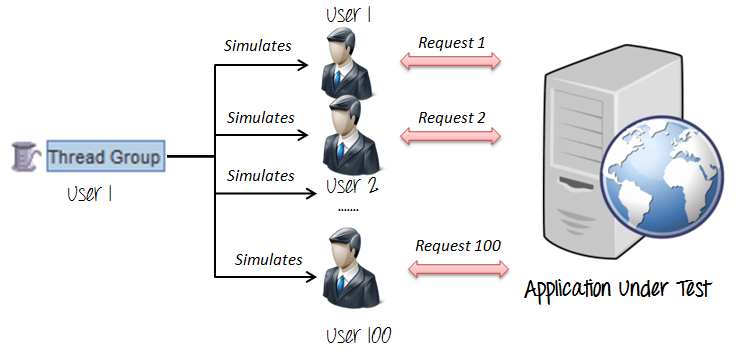
JMeter simulates a number of users sending requests to the Application Under Test. As soon as JMeter simulates requests, the server responds and Jmeter starts collecting data. Jmeter saves all the responses and based on the server response it returns statistics. These statistics show the performance of the AUT in the form of various formats as per the requirements.
Thus, with the help of JMeter, we can simulate load on the server, networks, or objects which are coming from different machines to implement real-world scenarios.
=> JMeter Workflow
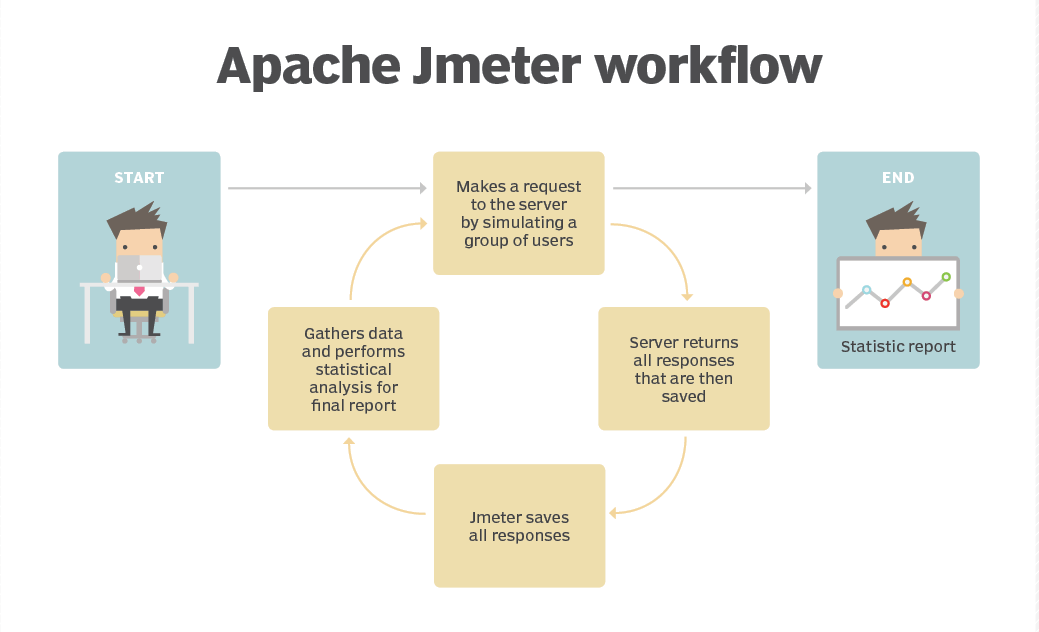
- The group of users will send the request to the target server.
- The server will respond back to the user’s request.
- Next, it will save all the responses for the given request.
- Now, it returns the statistics information of the targeted server to show the performance of an application.
- In the last step, it will display the performance report of an application.
Advantages of JMeter
- Free of cost – It is an open-source product with zero licensing cost.
- Can load test different kinds of applications – It can be used for performance testing of all kinds of applications ranging from – Web applications, web services, databases, LDAP, shell scripts, etc.
- Platform independent – Since, it is 100% Java-based, so it is platform-independent and can run on multiple platforms such as Windows, Linux, etc.
- Record and Playback feature – It provides record and playback options along with drag and drop features which makes it easier and faster to create scripts.
- Customizable – Since JMeter is open source, developers can customize its source code as per their specific requirements.
- Supports distributed load testing – It supports distributed load testing features in which we can create a master-slave set up for carrying out load tests on multiple machines.
- Good community support – It has many online tutorials and helps community support. It also has freely available plugins that help in different aspects of script creation and analysis.
- GUI: It is very easy to use as it has a friendly graphic user interface and you can become familiar with it in a short period of time.
- Multithreading Framework: It gives permission for the synchronous and parallel sampling of various functions by using different thread groups.
- Visualize Test Result: By using the JMeter tool, you can view the test results in various formats like chart, table, tree and log file.
- Easy Installation: There is no need for installation. The installation can be done very easily by running the *.bat file.
- Highly Extensible: JMeter allows to extend your own tests by using visualization plugins.
- Supports Multiple Testing: JMeter supports numerous testing processes like Load Testing, Distributed Testing, and Functional Testing.
- Support Multi-protocol: JMeter supports web application testing and also estimates the performance of database server. It gives multi-protocols such as HTTP, JDBC, LDAP, SOAP, JMS, and FTP.
- Script Test: You can incorporate the Bean Shell and Selenium with automated testing.
Disadvantages of JMeter
- Memory Utilization: JMeter reproduces heavy load and generates the information of the test. This leads to the utilization of plenty of memory and produces a large amount of memory from the heavy load.
- Web Application: You can test web applications by using JMeter, but cannot be used for the testing desktop application.
- Limited support: JMeter doesn’t support ajax, javascript, etc. We can’t render it like a browser so we can’t run the Javascript in the web application. It has limited support for the flash and other scripting languages, which will affect the accuracy of the application.
- Lack of Knowledge in Scripting: There is a lack of knowledge to understand scripting in JMeter. It needs some experience for understanding JMeter elements, regular expressions, session handling, etc.
- No visualization features: JMeter doesn’t support network visualization features compared to other performance testing tools like Loadrunner.
- Requires high configuration capacity: Single configuration machine is not sufficient to carry out load tests with a large number of users. In order to meet this requirement, we need high-configuration cloud machines or we have to do distributed testing.
- Limited real-time testing options: JMeter has very limited real-time test monitoring capabilities compared to other tools.
- No vendor support: JMeter is an open-source tool so it lacks vendor support for the application development compared to other commercial applications and their support. Only support possibilities are referring to the open source forums and communities.
- Large-scale testing: In case we want to perform large-scale testing, we have to create test servers and a centralized orchestrator should be built. All such things will become complicated when we use JMeter. It requires dedicated hardware and network resources, so it is unrealistic to perform large-scale testing.
- Lack of cloud adoption: Similar to other on-prem tools, JMeter doesn’t offer an option to host the application on the cloud or management opportunities. If we want our application to scale significantly or have distributed geographies then cloud adoption is a must.
- Excess memory consumption: JMeter can simulate heavy workloads and visualize the test report. It causes major memory consumption and results in the applications running out of memory.
Demo 1 : How to Perform JMeter Load Testing?
Before we begin with JMeter load testing, make sure you have JMeter installed in your system.
https://jmeter.apache.org/download_jmeter.cgi
In this, we are going to create a basic test plan in a few simple steps.
1. Setting up Apache JMeter
- The first step is to go to the Apache JMeter folder
- Go inside the bin folder
- Select the JMeter .bat file
- Double-click on this file
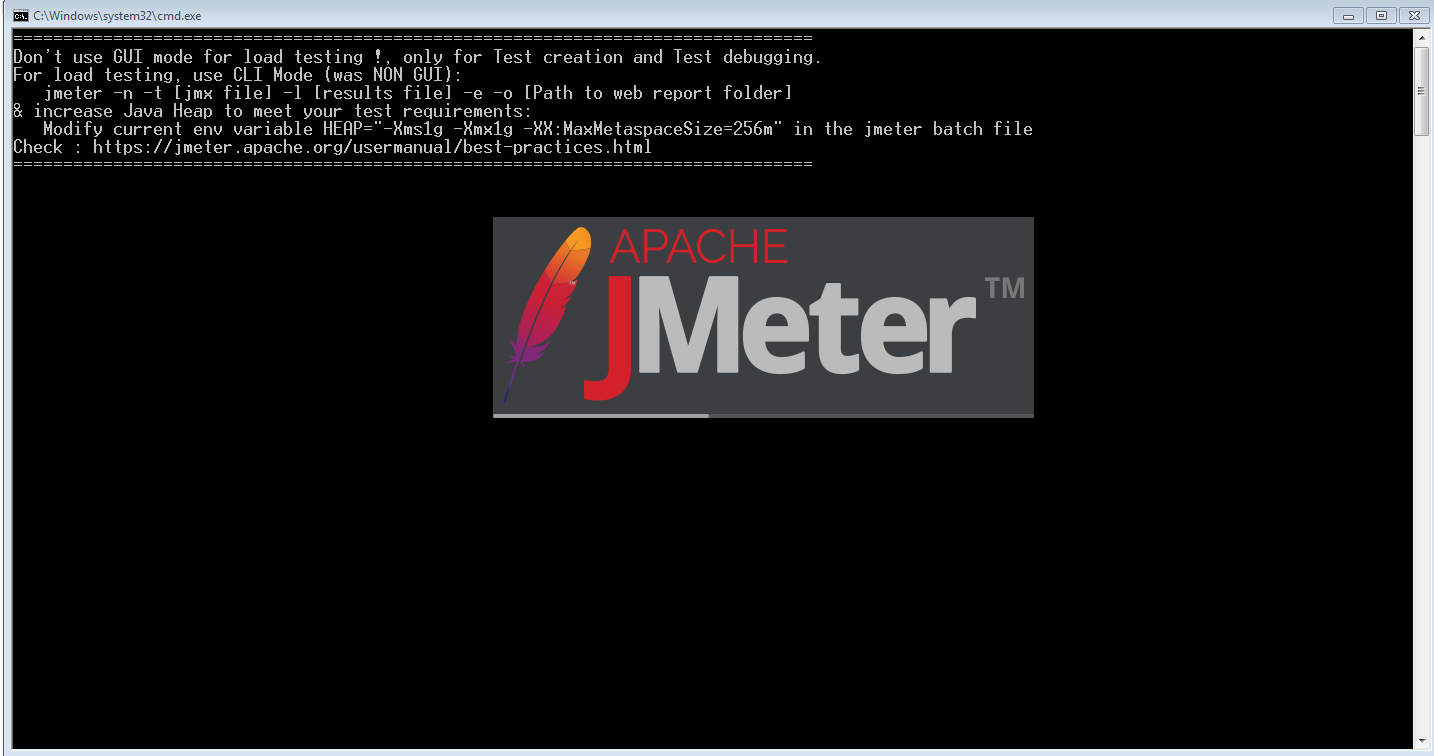
This might take a while, and then the JMeter window will open on the screen.
2. Adding a Thread Group
- Open the JMeter window.
- The window is divided into two parts. The left side has all the added elements, while the right side has all the configurations of that element.
- Rename the test plan and save it.
- Let’s rename it as the FirstJMeter.
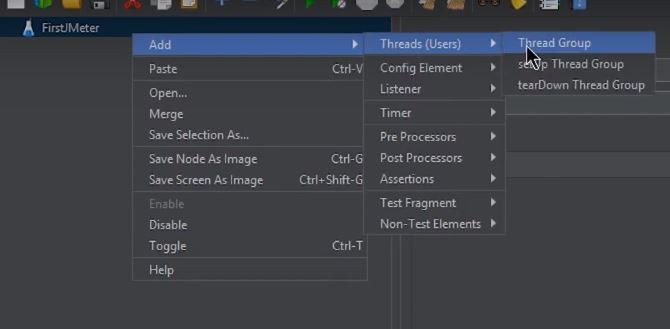
- Right-click on the test plan.
- Go to add -> Threads (Users) -> Thread Group
Now once you click on Thread Group, there are three things on the screen that are important concerning the load test:
- Number of Threads
- Ramp-Up Period
- Loop Count
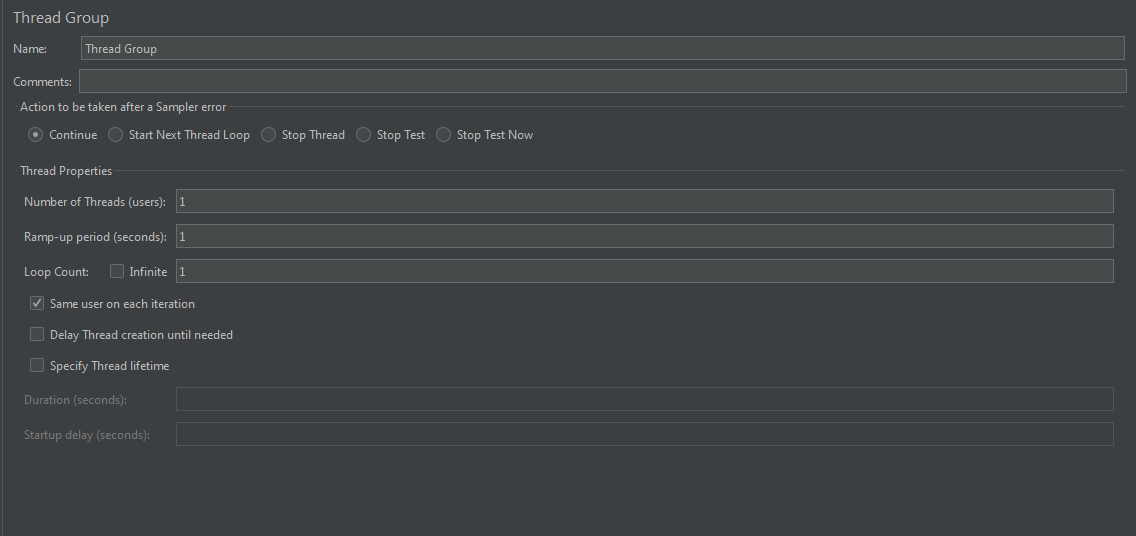
Let’s explore the Thread Group options:
Action to be taken after a Sampler error: These are the actions that can be taken by the user if an error occurs in any sampler. By default, this is set to Continue. let us see what all are the options that actually can be used
- Continue – To continue with the next element
- Start next Thread loop – which means stop this Thread group and continue with other thread groups of test plan
- Stop thread – To stop the current Thread
- Stop Test – If any error comes stop the test completely
- Stop Test Now – This is almost the same as above which means to stop the test immediately.
Thread Properties
- Number of Threads – This is the count of virtual users that we are expecting to connect to the server. For example, if we give 100, Jmeter will simulate 100 virtual users that connect to the server and perform the same steps given. By default, it is set to 1 thread.
- Ramp-Up Period – This can be defined as the time in which JMeter can bring the number of threads mentioned above into the running state. This is given in seconds. For Example: If you set “Number of Threads” to “20”, and “Ramp-Up Period to 40 seconds”, then JMeter will wait till 40 seconds to make all threads up and running. That means each thread will start 2 seconds late after the previous thread was started.
Formula: Ramp-Up Period / Number of Threads i.e. 40 / 20 = 2 (seconds)
- Loop Count – This indicates how many times each thread was supposed to perform the task. If the number of threads is 100 and the loop count is 2 then the same task will be performed 200 times. If this value is set to infinity the task will continue to run until the test was stopped. By default is value is one iteration.
- below these properties, there are a few checkboxes among which “same user on each iteration” is checked by default.
- Delay Thread Creation Until Needed – This is to be checked when the ramp-up delay and startup delay are to be performed even before the thread group is created. By default, this is not checked.
- Specify Thread lifetime – Here we can give the duration and startup delay to the threads.
Note: In all properties of the thread group the time is taken in seconds, not in minutes or milliseconds.
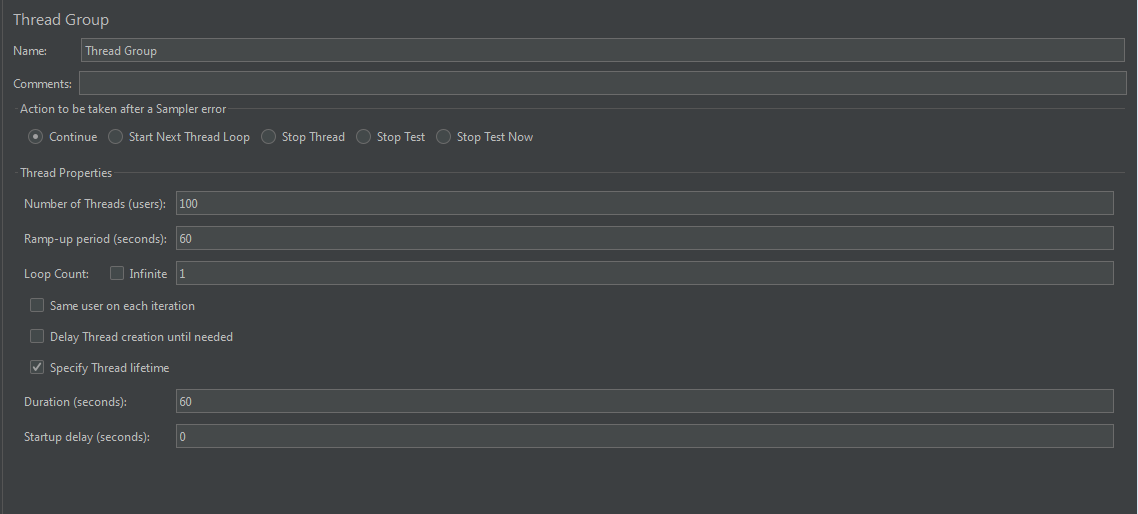
For example, if you set the number of threads as 100; JMeter will create and simulate 100 user requests to the server under test.
Let’s add value in thread property.
- Number of Threads(Users) : 100
- Ramp-Up Period(Seconds): 60
- Loop Count: 1
- Specify Thread lifetime
- Duration(Seconds): 60
- Startup delay (Seconds): 0
3. Add an HTTP Request Sampler
- Right-click on the Thread Group.
- Go to Add -> Sampler -> HTTP Request
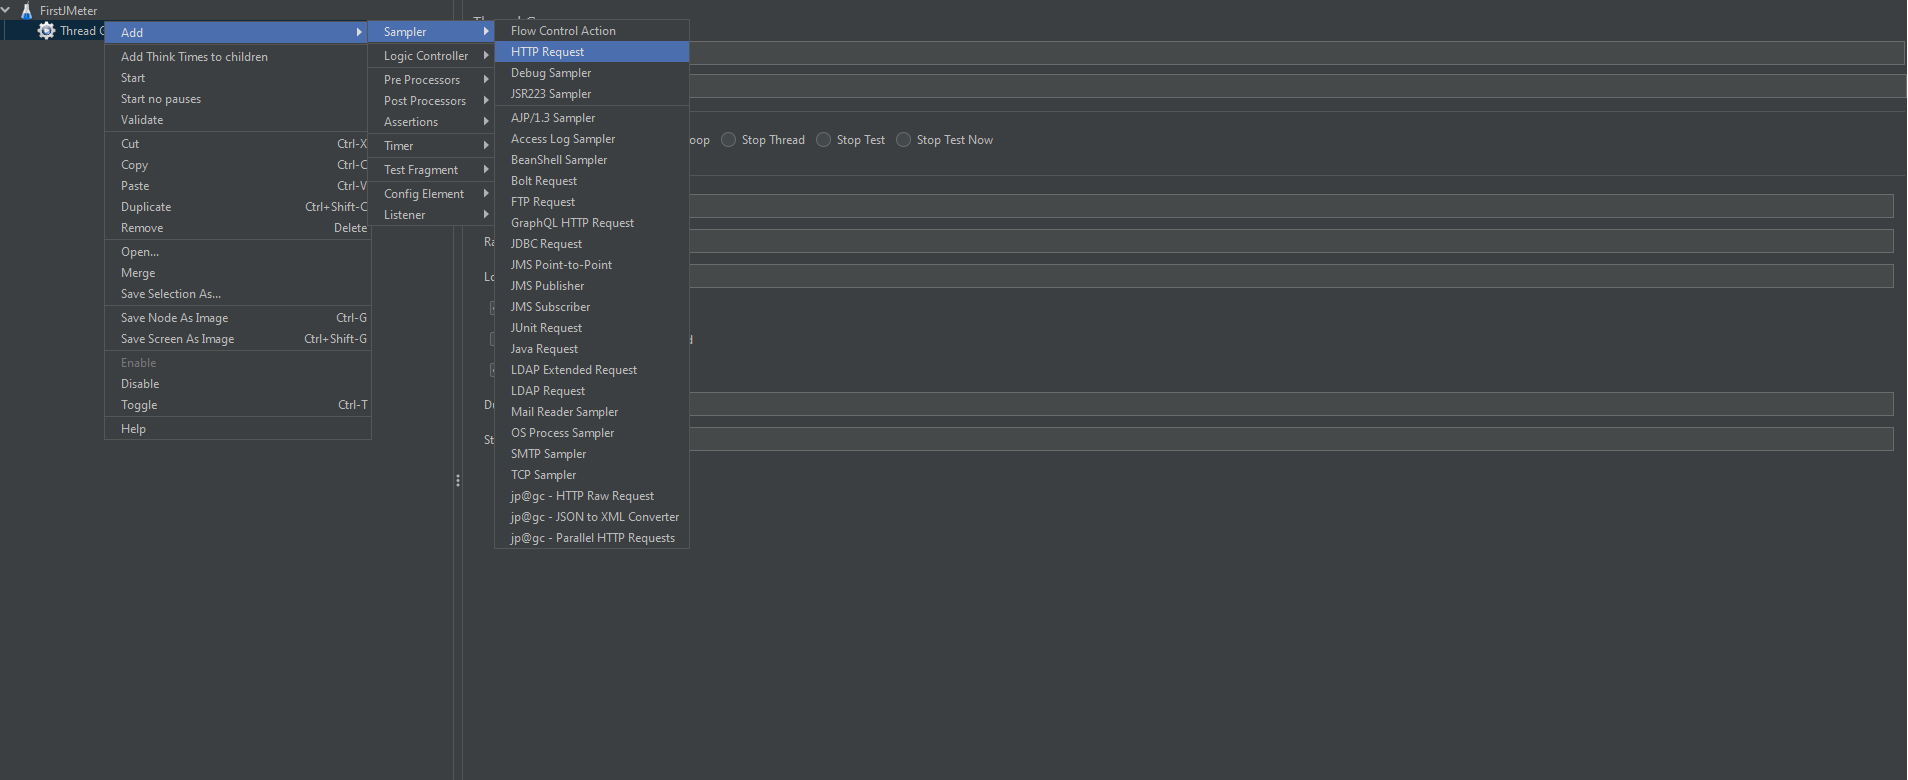
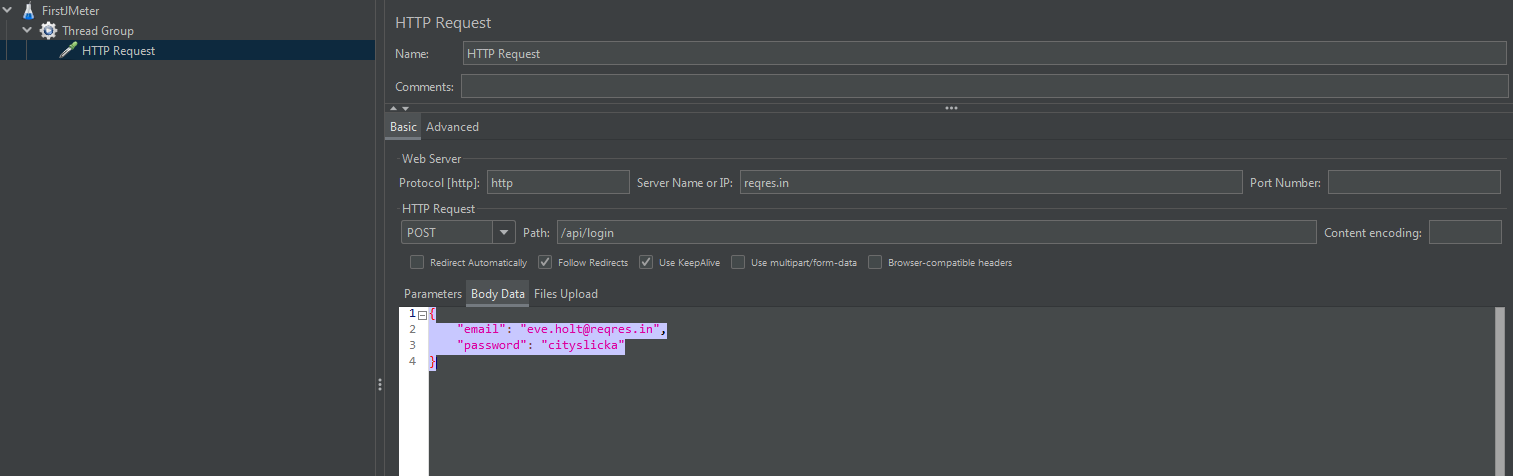
Under the HTTP Request section, HTTP Request gives the path that each thread or user will request. We will set it to be “/api/login” so that each thread can access the login page of our server.
Any number of HTTP requests can be added. Further, all you need to do is repeat the above step.
4. Adding Listeners
Listeners are something that is used to provide the outputs of a load test. There are different types of listeners present in JMeter, and a good deal may be added using plugins.
The listener we will use here is the Table, as it is comparatively easy to read.
- Right-click on the Thread Group.
- Go to Add -> Listener -> View Results in Table
- Go to Add -> Listener -> View Results Tree
- Go to Add -> Listener -> Aggregate Report
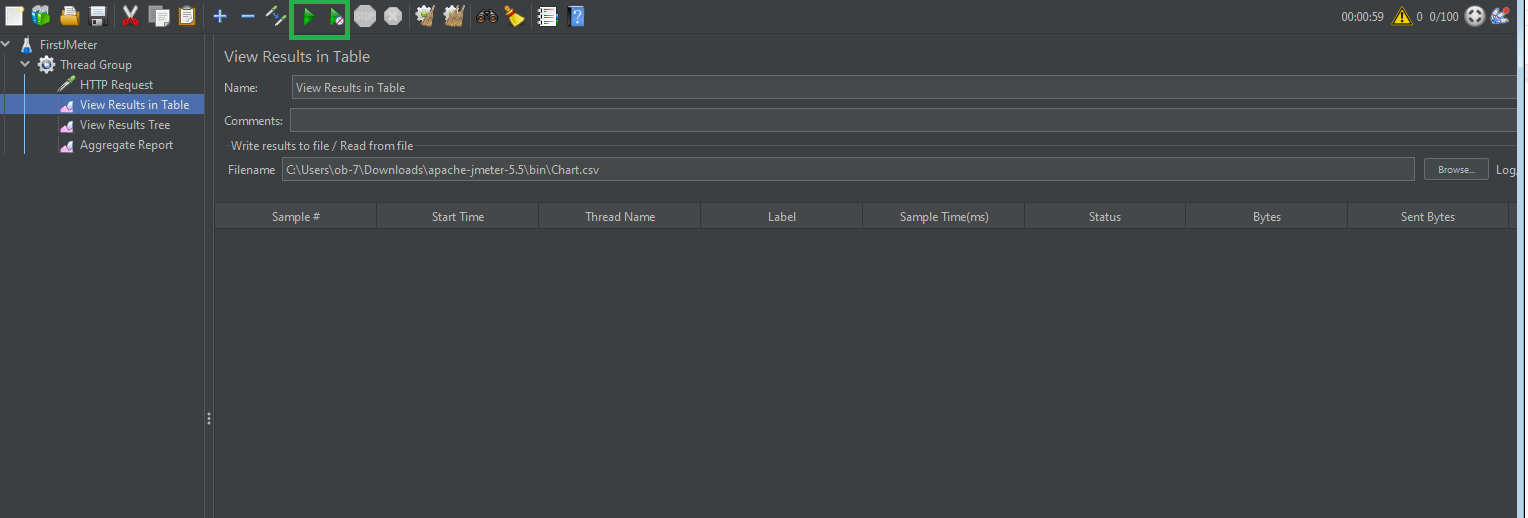
Now, it’s time to run the test.
5. Run the Basic Test Plan
- Save the test plan.
- Click on View Results in Table.
- Click on the Run button (green start button).
- Now when you visit the “View Results in Table,” you can see the test running. Same with View Results Tree & Aggregate Report results. Then you can also see the time the test has been executing.
- You will see the test results in the Table, View Results Tree & Aggregate Report as shown below:
Result 1 : View Results in Table
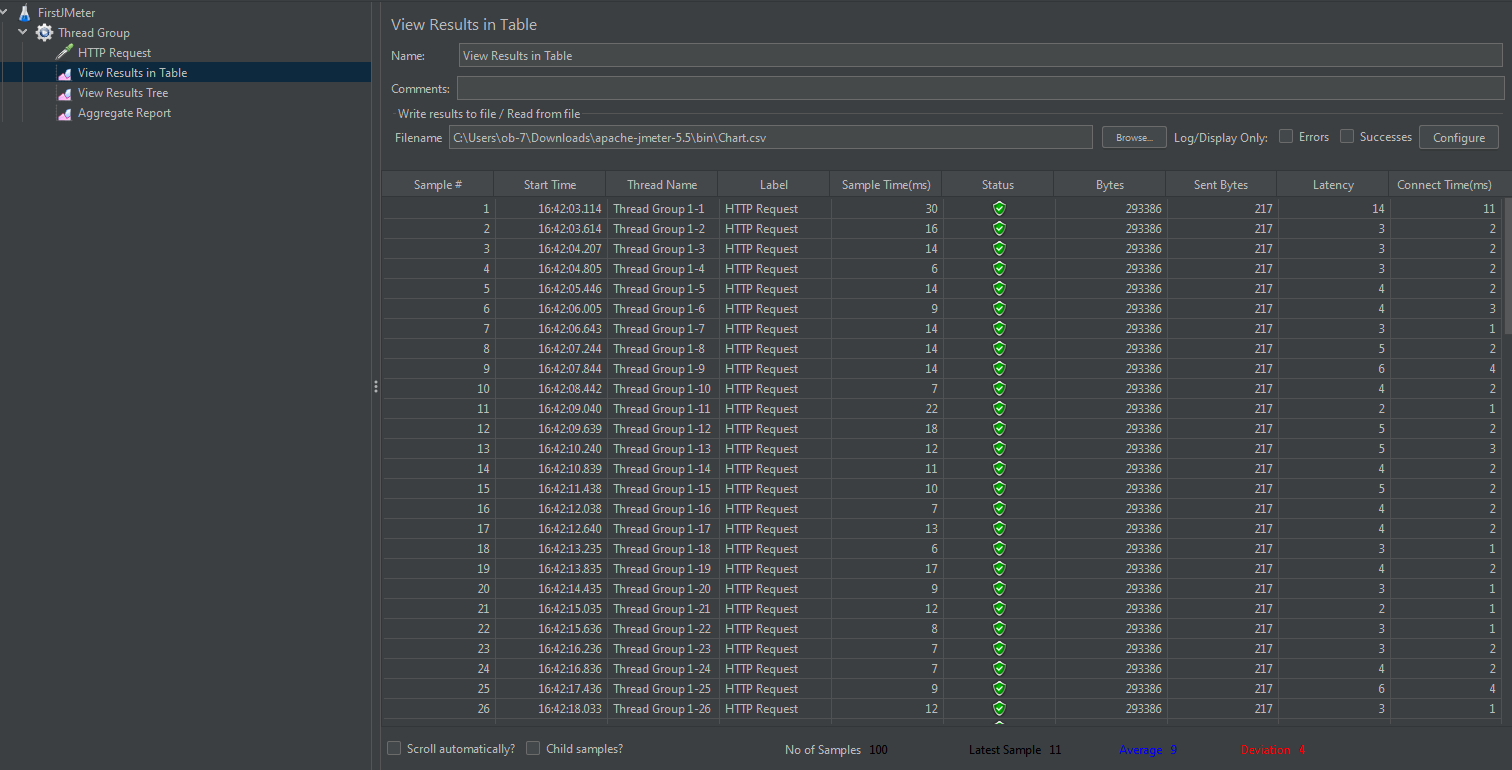
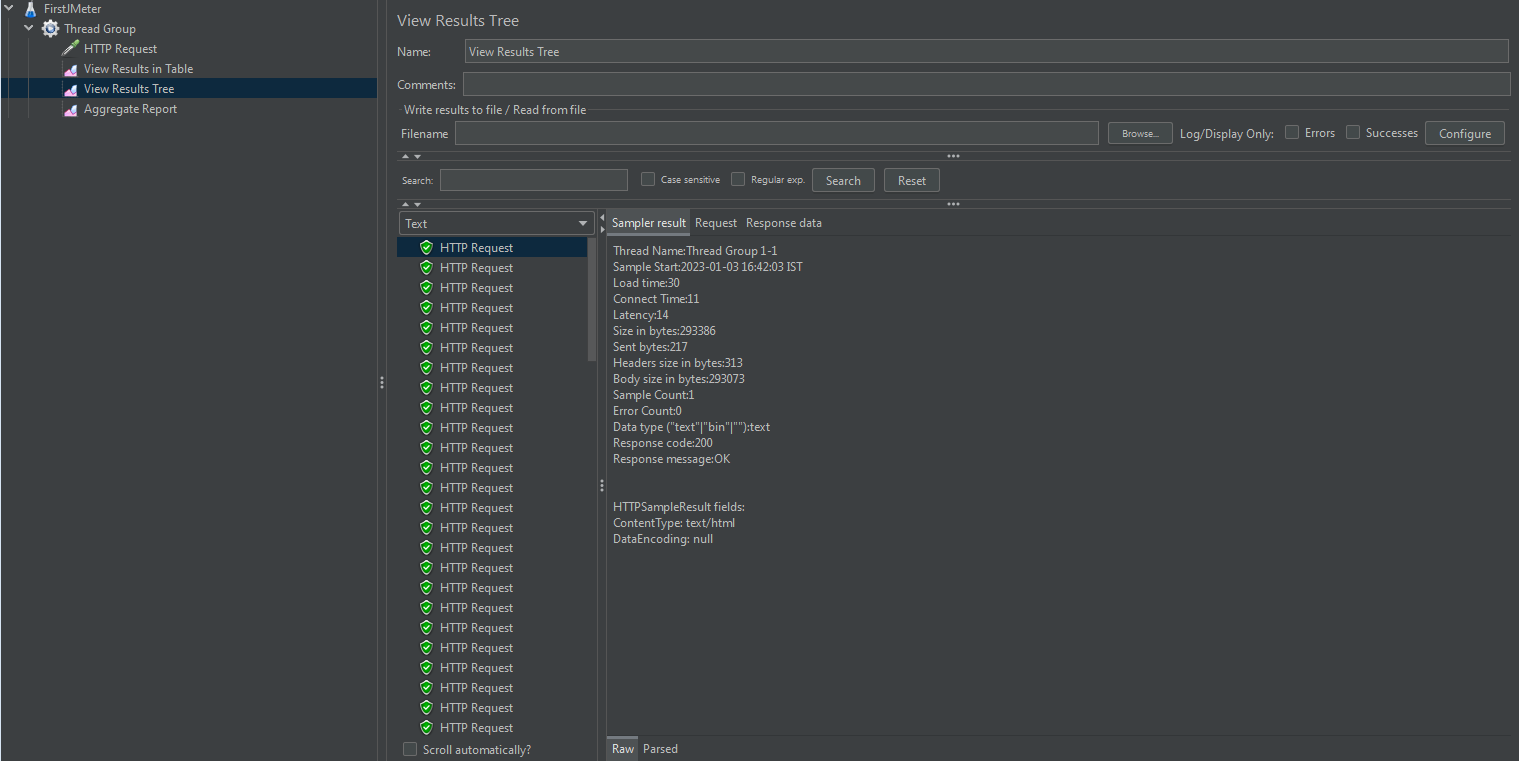
- The result shows the status of all the requests as “Success”. Then there are two important columns, Sample Time (ms) and Latency.
- Latency refers to the number of milliseconds between the time JMeter sent the request and when an initial response was received.
- Sample time refers to the milliseconds taken by the server to complete the request.
Result 2 : View Results Tree
Result 3 : Aggregate Report

=> Statistics
In the feature image above, you can see the Aggregate Report has 13 headers in its table. Let see what do they mean and how to calculate these data?
- Label: The label/name of the samples.
- Samples: The total number of samples executed.
The formula: Samples = Number of Threads (users) * Loop Count
Example 1: Thread Group has a configuration
– Number of Threads (users): 100
– Loop Count: 1
So, an HTTP Request under this thread group will run 100 x 1 = 100 (times)
—> # Samples: 100
- Average(millisecond): The average response time of a set of results.
- Min(millisecond): represent Minimum Response Time, it’s the shortest time for the samples with the same label.
- Max(millisecond): represent Maximum Response Time, it’s the longest time for the samples with the same label.
- Percentiles(millisecond): A percentile (or a centile) is a measure used in statistics indicating the value below which a given percentage of observations in a group of observations fall. For example, the 20th percentile is the value (or score) below which 20% of the observations may be found.
- Median: is a number which divides the samples into two equal halves. Half of the samples are smaller than the median, and half are larger (Some samples may equal the median.) This is a standard statistical measure. See, for example, Median entry at Wikipedia. The Median is the same as the 50th Percentile.
In other words, the median is the time in the middle of a set of results. 50% of the samples took no more than this time; the remainder took at least as long.
- 90% Line (90th Percentile) means 90% of the samples took NO MORE THAN this time. The 10% remaining samples took at least as long as this.
- 95% Line (95th Percentile) means 95% of the samples took NO MORE THAN this time. The 5% remaining samples took at least as long as this.
- 99% Line (99th Percentile) means 99% of the samples took NO MORE THAN this time. The 1% remaining samples took at least as long as this.
- Error %: Percent of requests with errors. Eg: the test runs Request A 100 times and got 15% Error, means the Request A has 15 times of error (100 * 15%).
- Throughput: is calculated as requests/unit of time. The time is calculated from the start of the first sample to the end of the last sample. This includes any intervals between samples, as it is supposed to represent the load on the server. The formula is:
Throughput = (number of requests) / (total time) * conversion
Where:
number of requests = number of executed requests
total time = (lastSampleStartTime + lastSampleLoadTime – firstSampleStartTime)
conversion: the unit of conversion value, for example 1000 will convert the value to the second, 1000*60 will convert the value to the minute, etc.
Example: I will run this test with 100 threads and loop count 1. Refer result below:
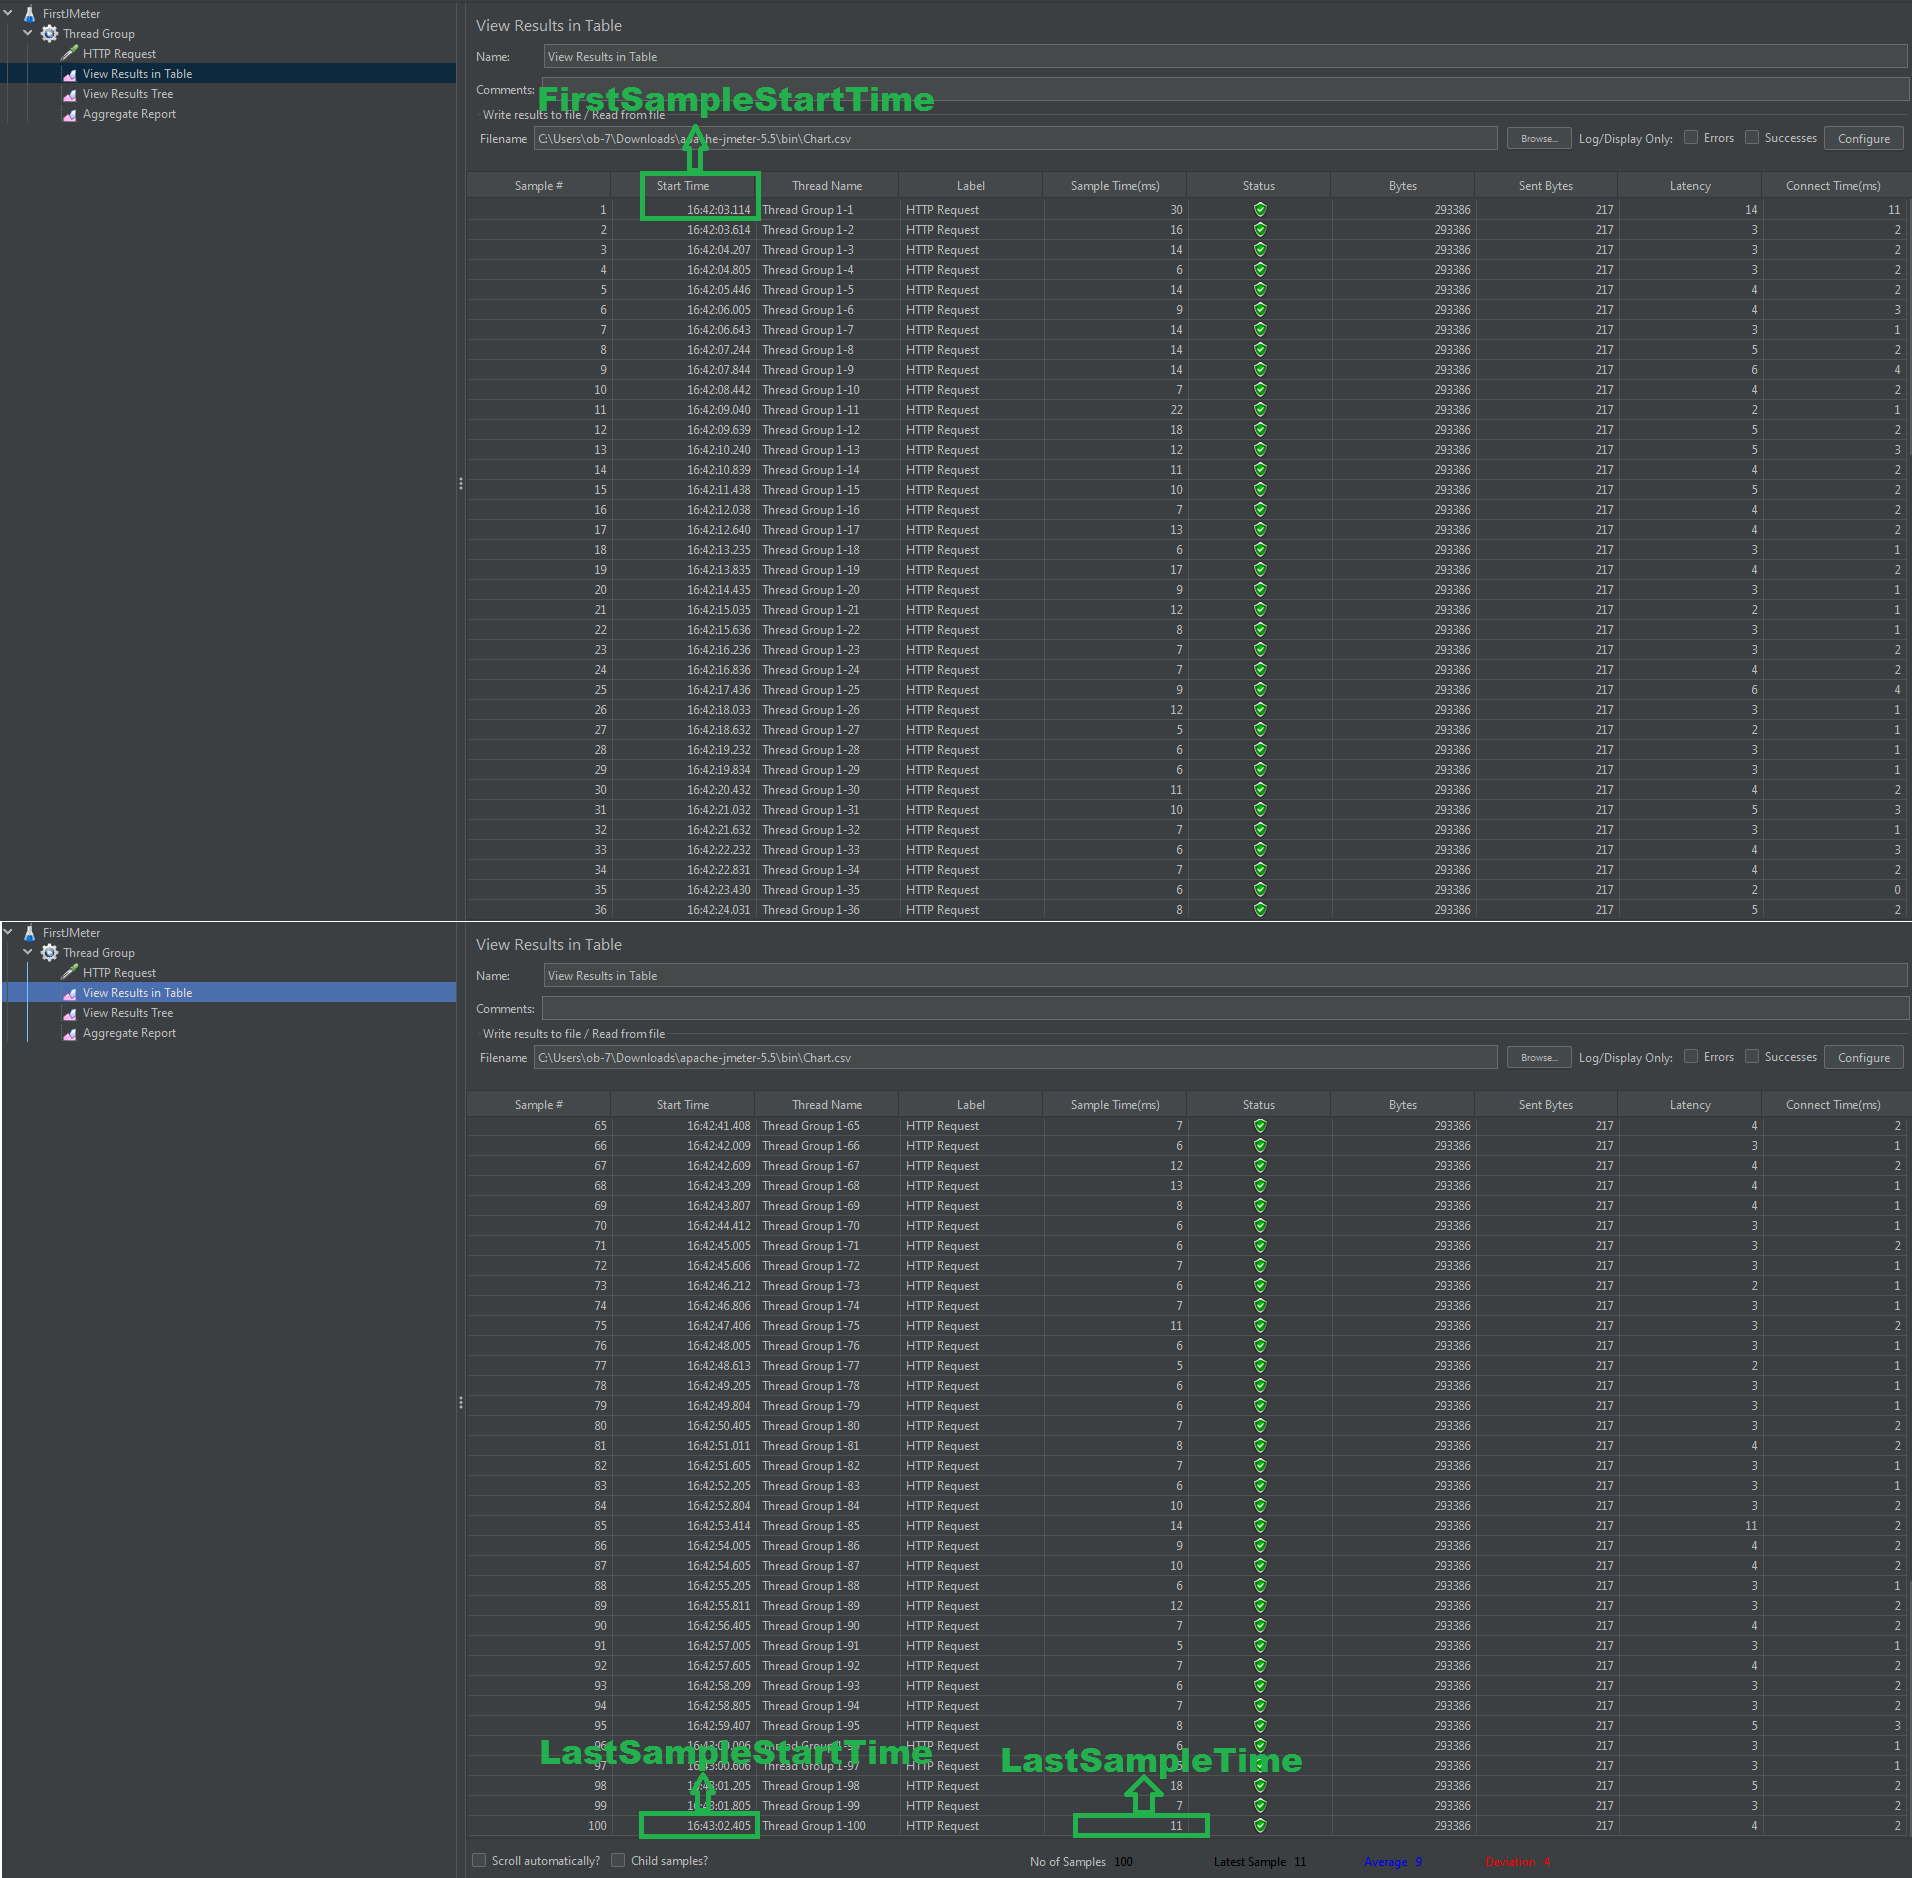
I used View Results in Table to collect the Start Time, and Response Time in the easiest way.
firstSampleStartTime: 16:42:03.114 (1672744323114 in ms)
lastSampleStartTime: 16:43:02.405 (1672744382405 in ms)
lastSampleLoadTime: 11ms
total time = (1672744382405 + 11 – 1672744323114 ) = 59302
number of requests = 100
Throughput = (number of requests) / (total time) * conversion
Throughput = 100 / 59302* 1000 ≈ 1.7/sec
Let’s check with the Aggregate Report:
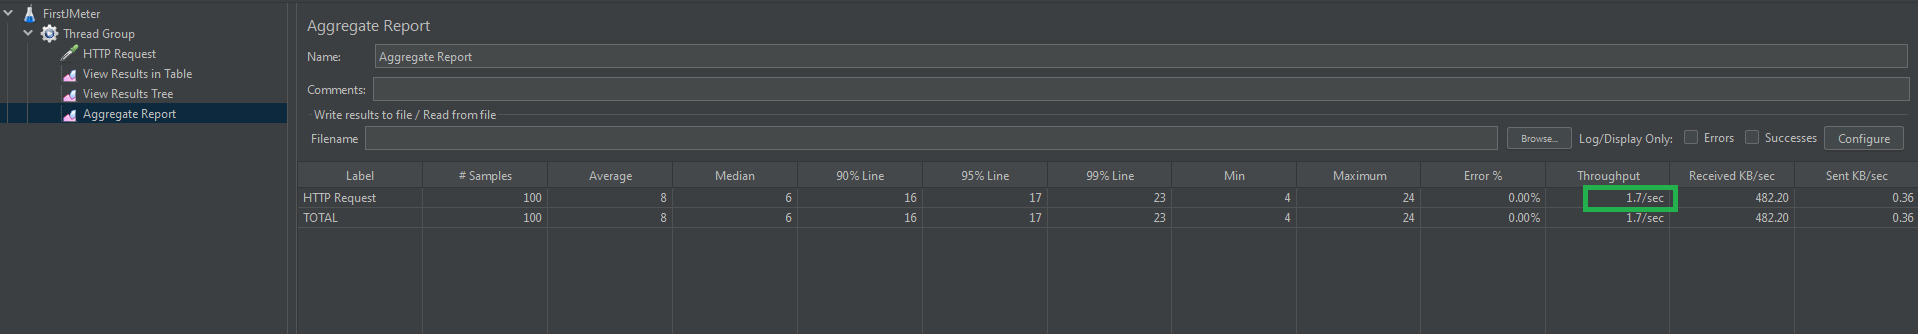
And it can prove that the formula works well. Let’s check it by yourself.
Note: The time unit is chosen so that the displayed rate is at least 1.0. When the throughput is saved to a CSV file, it is expressed in requests/second, i.e. 30.0 requests/minute is saved as 0.5.
- KB/sec: The throughput measured in Kilobytes per second. The formula is:
- Throughput KB/sec = (Throughput * Average Bytes) / 1024
- Where Average Bytes is the average size of the sample response in bytes. We can found this data on Summary Report.
- Total: The last row in the table is Total, only # Samples, the value in Total is equal to the sum of all values above. For all remaining value, it’s equal to the average of all values above.
- KB/sec: The throughput measured in Kilobytes per second. The formula is:
You can try the same demo by fluctuating the values of the number of threads or the loop. When you fluctuate these values, the sample time value or other output values will begin fluctuating, telling you if the system is overburdened or just fine.
Conclusion
By now, you would have understood everything you need to know about basic JMeter and its usage in load, performance, and API testing. Then finally, you understood the process of Load API Testing using JMeter with a hands-on demo.
To know more about JMeter API load Testing with real scenarios, you can have a look at this API Load Testing Using Apache JMeter (Step by Step Guide).